
Financial Market Insight
Highlights
Key Takeaways
- How AI Turned into a Headwind
- Updated Market Outlook: Three “AI Problems” to Monitor
- Economic Cheat Sheet – The First February Data is in Focus
- The Most Important Industry Right Now
Conclusion First on the Recent Volatility
The recent pullback in equity markets in February has been pinned all on AI. First showing up in software, as investors fear that AI could disrupt business models and pressure margins across parts of the industry. From there, the weakness spread in a familiar pattern, like a sector-by-sector game of Whack-a-Mole, with selling pressure rotating through several industries, including transportation, wealth management, insurance, and commercial real estate. That sequence has left many investors asking the same question: What area gets hit next?
The Vann Equity Management Investment Committee believes it is important not to let short-term headline-driven volatility dictate long-term decisions. Quite simply, retail investors are getting caught up in the emotional instability generated by these selloffs. AI is likely to drive meaningful productivity gains over time through automation, faster decision-making, and deeper analysis. In many cases, those benefits should strengthen companies by improving efficiency and supporting profitability rather than undermining them.
In our view, markets are also working through a much-needed pause after strong gains, essentially digesting what has already been priced in. Even so, the S&P 500 can still recover ground and potentially finish with its second consecutive monthly gain in 2026. Historically, when the S&P 500 has risen in both January and February since World War II, the average full-year total return has been above 24%, and those years have shown a consistent pattern of finishing higher.
Stocks
S&P 500
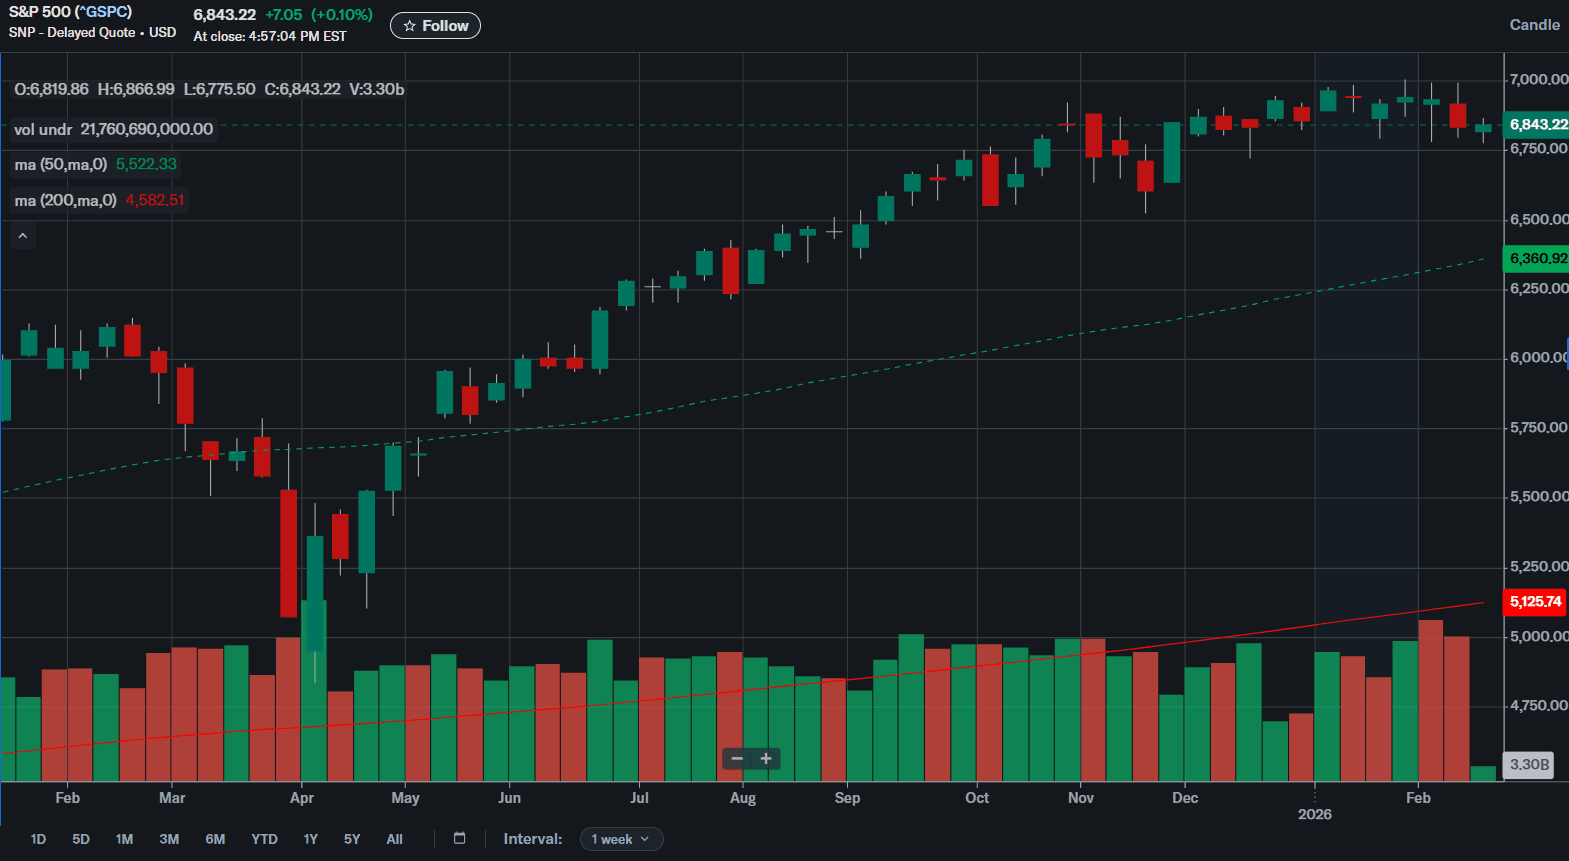
Technical View: The January rally to record highs shifted the technical outlook from cautious to bullish. However, the recent volatility has kept conviction notably low.
Primary Trend: Bullish (since the week of December 22, 2025)
Key Resistance Range: 6,910 to 6,975
Key Support Range: 6,820 to 6,795
Current Level: 6,843.22 (weekly close)
SOURCE: Factset and Vann Equity Management Research Team
✓ What is Outperforming: AI-related tech, cyclical sectors, small caps.
✓ What is Underperforming: Defensive sectors, energy.
Stocks fell more than 1% last week as worries that AI would disrupt non-tech industries undermined the rotation trade that had been supporting markets.
How AI Became a Market Headwind
One of the biggest market shifts so far in 2026 is that AI-related headlines have flipped. What had been a steady tailwind for stocks is now acting like a headwind, as investors question the ROI (return on investment) of massive AI spending and worry that AI could disrupt parts of the economy faster than expected.
The Setup: Why AI Was Treated as Universally Positive
For most of the last three years, investors treated AI as broadly positive for stocks. The core belief was that AI would boost productivity and lift profits over time. A second belief sat in the background: AI spending was treated as almost automatically good spending, so markets rewarded companies that leaned in the hardest.
The Turning Point: When the Market Started Demanding Proof
That optimism peaked around major announcements showing huge demand for AI infrastructure. A standout example was Oracle, which surged on news tied to a massive cloud backlog (contracted future revenue that has not been fully recognized yet).
After that, sentiment started to shift from excitement to scrutiny. Instead of cheering every new dollar of AI spending, investors began asking: who actually earns a return on this, and how soon?
The Three Problems Driving The Shift
Problem 1: Concentration Risk
A key concern is that a meaningful portion of the AI infrastructure enthusiasm has been tied to the spending plans of a small number of buyers, including OpenAI. The market narrative included very large, long-range infrastructure commitments. The risk is straightforward: if financing becomes harder, demand slows, or competition changes the economics, then some expectations embedded in prices could be too optimistic.
Problem 2: Competition changes the spending math
In late 2025, Alphabet highlighted how quickly the competitive landscape can change with Gemini. The reason this mattered to markets is not only who has the best model, but what it implies:
- If competition pressures pricing and market share, spending plans across the ecosystem may become less certain.
- If leading players can deliver strong results using more in-house hardware, then demand assumptions for certain chip and infrastructure vendors can be questioned.
- If multiple firms can achieve similar outcomes, AI could commoditize (become more interchangeable), which would lower expected returns on some of the most aggressive buildouts.
Put plainly, Gemini helped break the old idea that every dollar spent on AI is automatically a winning dollar. It pushed investors to focus on capex (capital spending on long-lived assets like data centers and hardware), free cash flow (cash left after operating costs and capital spending), and measurable returns.
Problem 3: Cannibalization risk spreads beyond tech
This concern has grown more recently. AI is not only about replacing tasks inside an industry, but it can also pressure the economics of entire industries. That is why software weakness has been so sharp, and why investor anxiety has rotated into other groups as people ask which business models could be disrupted next.
The broader impact is that it makes sector rotation harder. When investors start to believe “no sector is safe,” the market can feel jumpier even if the overall economic backdrop is still solid.
The Big Picture Takeaway
The 2023 to 2025 bull market was powered by two forces:
- Higher earnings expectations, especially for major tech linked to AI demand
- Multiple expansion (stocks getting more expensive relative to earnings) because investors assumed AI would raise long-term growth for many industries
Recent AI headlines are pressuring both beliefs. That does not mean AI is “over.” It means the market is moving from story to proof.
What could calm volatility from here?
In the view of the Vann Equity Investment Committee, the market likely needs a clear proof point that:
- AI capex is producing a positive ROI within a credible time frame
- AI will more often enhance entrenched businesses through efficiency and productivity, rather than simply destroy revenue models
Until we get more proof on those two points, mixed sentiment and elevated volatility are a reasonable base case.
Economic Data (What You Need to Know in Plain English)
Economic data to start the month of February continues to support the Goldilocks trend of economic growth that is steady but not too hot, with inflation not accelerating, which has supported markets since late November. Just as important, it pushed back on the small rise in concern about the labor market.
The key report was the delayed jobs report, and it was better than expected, landing in our “Just Right” scenario, meaning the numbers are strong enough to support growth, but not so strong that it forces higher interest rates. The December jobs report showed 130k jobs added versus expectations of 65k. That result helped offset the four softer labor market readings from two weeks ago. Even more importantly, the unemployment rate fell to 4.3%, backing off solidly from the recent high of 4.6% and moving further away from the more concerning 5.0% level.
On the other side of the coin, the most notable growth report was a disappointment. December retail sales were soft on both the headline and, more importantly, in the details. The headline reading was flat versus expectations of 0.1%. The control group, which is retail sales excluding autos, gasoline, and building materials, fell to negative 0.1% versus expectations of 0.4%. That decline matters because many categories tied to discretionary consumer spending also fell. Still, while this was not a good report, it will likely take several softer retail sales reports and more cautious commentary from credit card companies before we grow materially more concerned about the consumer.
Finally, Friday’s CPI report continued the Goldilocks data trend. Headline inflation was slightly better than expected at 0.2% month over month versus 0.3% expected, and 2.4% year over year versus 2.5% expected. Core CPI met expectations at 0.3% month over month and 2.5% year over year. From a Federal Reserve standpoint, the CPI report did not change the rate cut outlook, which remains July, with June still possible. As a result, the market impact was limited. Bottom line, the report reinforced that while inflation is not yet at the Fed’s 2.0% target, it remains mostly stable, which is supportive of eventual rate cuts.
The First look at February economic data, both the Empire State manufacturing survey and Philly Fed survey were better than expected in January, and markets will be looking for stability. After a strong late 2025 and early 2026 backdrop, our investment team wants to avoid any signs that growth suddenly slowed as February began.
On the Fed front, we get FOMC Minutes on Wednesday. Markets and our investment team will closely read them for any clues on how open the committee is to cutting rates in the coming months.
SPECIAL REPORTS AND EDITORIAL
The Most Important Industry Right Now
Tech weakness and AI skepticism are still weighing on stocks. Even after the strong jobs report sparked an early bounce, selling in key tech areas, especially software, pulled the market back down.
Right now, the center of this wave of AI anxiety is software. That is why IGV (iShares Expanded Tech Software Sector ETF) is the most important Industry and ETF to watch. If IGV cannot stabilize, it is hard to argue that the broader tech and AI complex will stabilize either.
Key level: IGV needs to hold last week’s low near $79.27 for broader tech sentiment to start improving. That is the first line in the sand we are watching.
Is Tech Flashing a Warning Signal for the Broad Market?
Not yet, based on recent history.
In past episodes where tech weakness spread into a broader market problem, the Nasdaq fell 10% or more. As of Thursday, low on February 5, 2026, the Nasdaq Composite was down about 5.5% from its recent high, which is not large enough to be a clear broad market trigger.
Key levels to watch on the Nasdaq:
- Around 22,500 as a near-term support area
- Below 22,000 would be a more meaningful warning sign
What to Do to Diversify Away From Tech
Even if the Nasdaq has not fallen enough to automatically drag down the whole market, this is the most uncertain period we have seen for the AI and tech-led rally in three years. The skepticism is coming from real questions, including:
- How long investors will tolerate heavy AI spending before demanding clearer returns
- Whether AI hurts revenue pools in parts of the economy instead of only improving efficiency
- How long does it take for AI investment to show up in earnings growth
- Whether infrastructure and resource constraints limit the pace of buildout
As your advisors, we are reducing tech concentration while staying invested in large caps.
These are four approaches that working with your advisor can help reduce exposure:
- Reduce tech dominance, but keep Large-Cap exposure
Reducing the number of names and weighting of technology companies across our managed portfolios. - Add geographic diversification by increasing allocations to our VEM International ADR portfolio
Developed international markets typically have much less tech concentration. - Tilt toward our VEM Large Cap Value:
Maintains Large-Cap exposure with more weight in financials, health care, and industrials, and usually much less tech. - Lower Volatility tilt:
Our internally run models are favoring a more defensive sector exposure and less tech. We are also allocating to our quality factor of momentum and risk, which tend to carry a much larger technology weight.
Bottom Line:
This is not a call to abandon tech, and it is not accurate to say the AI outlook has turned definitively negative. However, it is fair to say that the market is demanding proof in a way it has not for most of this cycle. For more risk-averse clients, trimming tech exposure can make sense, and these four tools can do that while keeping broad long exposure to large caps.
Ready to Navigate These Markets Together?
Schedule your portfolio review to discuss how these market dynamics may impact your allocation strategy.
Schedule Your Review