
Financial Market Insight
Highlights
Key Takeaways
- Two Events That Could Actually Cause a Pullback
- Weekly Market Preview: All About the Fed (Does Powell Signal a September Cut on Friday?)
- Weekly Economic Cheat Sheet: Important Growth Updates This Week (Do They Push Back on Stagflation Worries?)
- What Happens if AI Starts to Lose Momentum?
- The Hot PPI Threatens Multiple Pillars of the Rally
Stocks
Stocks rallied last week despite hotter-than-expected inflation data (in total) and some disappointing tech/AI earnings, as stable growth and still-high expectations for Fed rate cuts powered stocks to new all-time highs.
✓ What is Outperforming: AI-related tech, cyclical sectors, small caps.
✓ What is Underperforming: Defensive sectors, energy.
Two Events That Could Actually Cause a Pullback
The S&P 500 has pushed to new all-time highs month-to-date, even as the flow of news has been more negative than positive. Inflation metrics remain stubborn: CPI was mixed but still above the Fed’s 2% target, while PPI came in hot. Corporate earnings in the AI sector were also uneven—AMAT issued soft guidance, and both C3.ai (AI) and Core Weave (CRVW) sold off sharply. Geopolitical tensions persist, and expectations for Fed rate cuts have been trimmed, though markets still broadly anticipate a September cut.
Despite these headwinds, equities rallied. The reason: none of the data was severe enough to shake investor conviction in the two drivers of this market:
- Tariffs will not trigger stagflation (a toxic mix of weak growth and high inflation).
- AI enthusiasm remains intact as a growth engine for earnings and valuations.
Last week’s news did, however, inch toward those risks. With hot inflation raising the possibility that tariffs could fan price pressures, and AI earnings were disappointing, but neither development was dramatic enough to alter the prevailing narrative. Markets effectively shrugged them off.
Bottom line: There is plenty of noise—conflicted inflation data, questions about data accuracy, geopolitics, and AI momentum. But cutting through it all, investors are really asking two questions:
- Has the likelihood of tariff-driven stagflation increased materially?
- Has AI optimism been seriously undermined?
So far, the answer to both remains “no.” As long as that holds, volatility is possible, but the market trend should remain higher.
Economic Data (What You Need to Know in Plain English)
August was squarely on inflation, and the data delivered a rollercoaster ride for investors. CPI came in relatively tame, sparking optimism for Fed rate cuts and pushing the S&P 500 to fresh all-time highs above 6,400. But enthusiasm was quickly checked by a much hotter-than-expected PPI report, which erased some of the gains and reminded investors that the path to lower inflation remains uneven.
Starting with the Consumer Price Index (CPI), the headline number was encouraging, rising 2.7% year-over-year versus expectations of 2.8%. Core CPI, however, increased 3.1% compared to estimates of 3.0%. While that core reading was hotter, markets largely looked past it. The upward pressure was concentrated in services categories like dental care and airfare (areas that are not tied to tariffs and therefore less relevant to the broader inflation debate). As a result, CPI was interpreted as easing inflation worries, and markets moved to full price in the September Fed rate cut, fueling last week’s rally.
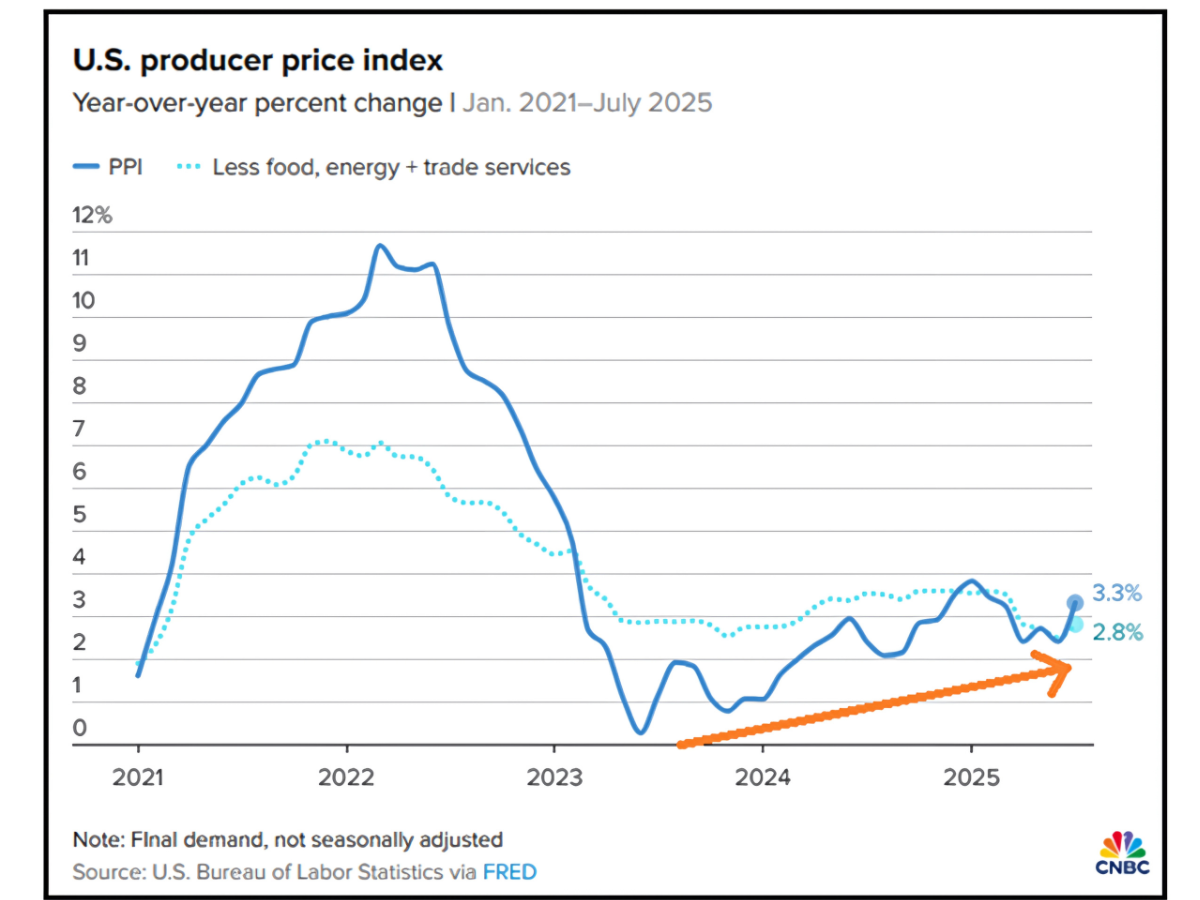
The Producer Price Index (PPI), however, told a different story. PPI surged 0.9% month-over-month (vs. expectations of 0.2%) and 3.3% year-over-year (vs. 2.5% expected, and up from 2.4% the prior month). Like CPI, the strength came from services, airfare, cable, and internet in particular. However, unlike CPI, the surprise was too big to dismiss. While it did not cause a sustained selloff, it did pull markets back from their highs and highlighted that inflation risks remain.
The key takeaway is that neither CPI nor PPI showed meaningful evidence of tariff-driven goods inflation, which is the real concern for stagflation. For now, markets remain confident that the Fed will cut rates in September and again in December, with a possible October cut still on the table. Nonetheless, the outlook will hinge on the next three major inflation readings (Core PCE, CPI, and PPI), which will set the tone for the remainder of the year.
On growth, the story was steadier. July retail sales were a touch light on the headline (0.5% vs. 0.6% expected), but June was revised higher, and the “control” group beat expectations with an upward revision. The data confirmed that consumer spending remains resilient, countering fears that the economy is slipping toward stagflation.
Looking ahead, we are looking for clarity from the Fed. Chair Powell’s speech at Jackson Hole on Friday, 08/22/2025, is the most important event, though it is notoriously difficult to predict whether he will address monetary policy directly. A signal toward a September cut would be well received, while a pushback, or silence, could pressure markets. In addition, the release of July FOMC minutes will be closely watched after two officials dissented in favor of a cut, the most since the early 1990s. If the minutes suggest broader support for easing, markets will likely interpret that as dovish. Finally, Thursday’s flash PMI for August will provide the first major read on growth this month, and the stronger the number, the more it will calm lingering stagflation fears.
Bottom line: August remains a month defined by the tug-of-war between inflation, Fed policy expectations, and growth. Last week’s data kept the hope of near-term rate cuts alive while reminding investors that risks have not disappeared. As long as confidence in Fed easing and consumer resilience holds, the market’s momentum should remain intact.
Commodities, Currencies & Bonds
Commodities were mostly lower last week as economic data continued to point to rising stagflation risks, a negative for growth-sensitive energy futures, while hot inflation data in the back half of the week weighed on gold.
Commodities were mostly lower in August as gold pulled back from record highs and oil slid to multi-month lows. The move was driven by a hot PPI report, easing geopolitical fears, and renewed questions about demand. Copper continued to churn sideways after July’s historic collapse, leaving broad weakness across energy and metals. The commodity ETF (DBC) fell 0.32% for the week.
Energy: Oil was in focus as optimism for a ceasefire between Russia and Ukraine, encouraged by pressure from the Trump administration, reduced the geopolitical risk premium that has supported prices since 2022. A soft EIA report added to the pressure, sending WTI to its weekly lows before stabilizing into the weekend. WTI continues to face downside risk toward $60/barrel. A break below that level could trigger a test of 2025 lows near $55, while upside resistance remains heavy between $65–$70 unless a fresh geopolitical shock emerges.
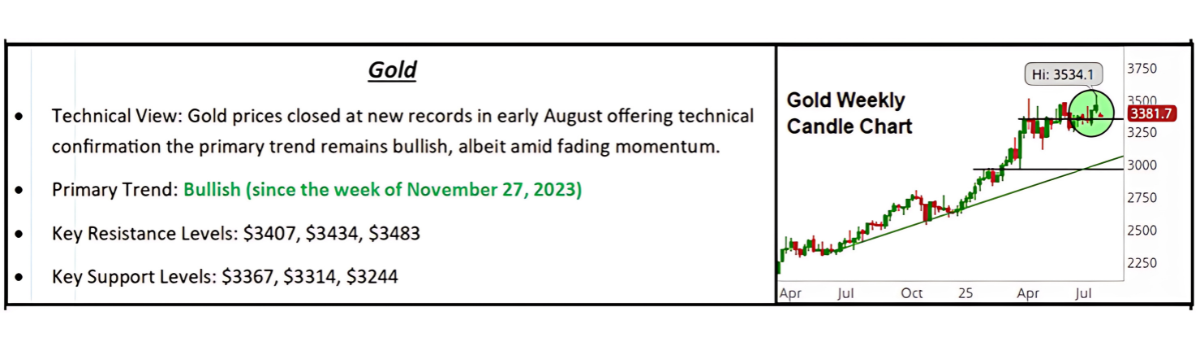
Precious Metals: Gold looks to be in a basing pattern after significantly higher moves over the last several months. While the long-term uptrend is intact, momentum has cooled, leaving gold vulnerable to further pullbacks if the dollar strengthens or the Fed leans hawkish.
Currencies: The Dollar Index closed below 98 for the first time since mid-July as markets priced in a September Fed cut. Overall, a stable dollar in the mid-to-upper 90s is neutral for stocks and should not disrupt equity momentum.
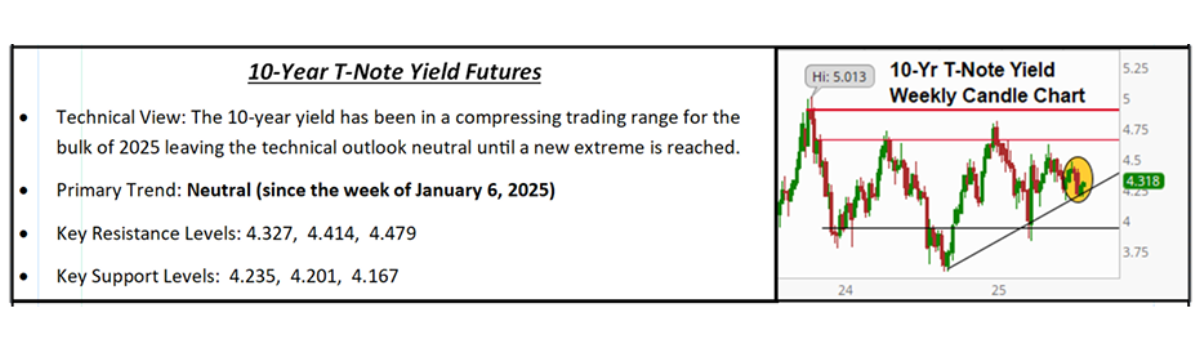
Treasuries: The 10-year yield remains in the 4.20%–4.30% range, remaining broadly neutral for equities. A gradual drift toward 4.15% would support stocks, while a move toward 4.50% would become a headwind. This week, Powell’s Jackson Hole speech and incoming data will be the key drivers for bond markets.
Bottom line: Commodities have softened, the dollar is lower, and Treasuries stay range-bound as markets balance inflation fears with Fed cut expectations. The picture remains one of consolidation rather than breakdown, with the Fed’s next signals likely to dictate whether these trends extend or reverse.
Special Reports and Editorial
What Happens if AI Starts to Lose Momentum?
While most of last week’s attention was on CPI and Fed policy, two high-profile AI bellwethers posted disappointing results. C3.ai (AI) dropped 25% after soft guidance, while Core Weave (CRWV) fell 21% following weak earnings. Those sharp declines raise an important question: What happens to this market if AI loses momentum?
It is easy to focus entirely on tariffs, inflation, and economic growth, but history reminds us that markets can falter even when the economy holds up. During the dot-com bubble, for example, the S&P 500 lost more than 20% between March 2000 and August 2001, despite unemployment rising modestly from 4.0% to 4.6%. The economy remained broadly stable until the combination of the tech bust and September 11th finally tipped it into recession. In other words, the bursting of tech enthusiasm itself was enough to drag markets down.
The parallel matters now. The current rally has been disproportionately fueled by AI-linked mega-cap stocks. Five names (NVIDIA, Microsoft, Meta, Broadcom, and Palantir) account for about 6% of the S&P 500’s 9.7% year-to-date return, or roughly 60% of the index’s gains. More broadly, the Information Technology and Communication Services sectors together make up two-thirds of the rally.
Bottom line: The market is acutely vulnerable to a loss of enthusiasm in AI. Even if the broader economy remains resilient, whether in a soft-landing or stagflation-light scenario, a slowdown in AI momentum would represent a real headwind for equities. The declines in C3.ai and Core Weave serve as reminders that execution, not just narrative, now matters for AI companies, and by extension, for the market as a whole.
The Hot PPI Threatens Multiple Pillars of the Rally
The July Producer Price Index (PPI) surged by the most since March 2022, rising more than four times the consensus estimate. That surprise matters because it threatens several of the “pillars” currently supporting the 2025 stock market rally.
Pillar 1: Inflation Is Widely Expected to Return to the Fed’s 2% Mandated Target
Markets have been priced for inflation to steadily move back toward the Fed’s target. Historically, PPI leads CPI, so if July’s spike is the start of renewed wholesale price pressures, history suggests consumer inflation could reaccelerate within two to six months. That outcome is not reflected in record-high stock prices.
Pillar 2: The Fed Is Expected to Resume Rate Cuts in September
The expectation of resumed rate cuts this fall rests on inflation staying contained. But if PPI proves to be an early warning of hotter CPI, the Fed faces a dilemma: support a weakening labor market (as July’s jobs report suggested) or hold off on easing to fight inflation. Either way, higher inflation reduces the case for near-term rate cuts—the second key pillar of this rally.
Pillar 3: Corporate Earnings Are Seen Growing Solidly into 2026
Corporate guidance during Q2 built confidence that earnings growth would remain strong into next year. But higher producer prices mean rising input costs, which could compress margins. If companies pass those costs to consumers, it feeds back into inflation, threatening both corporate earnings and the Fed’s ability to cut rates.
Bottom line: The July PPI report represents more than a one-off surprise. It directly challenges expectations for falling inflation, steady Fed easing, and resilient earnings—all of which underpin the current market rally. With the S&P 500 trading at 22x 2026 earnings estimates, any shift toward stagflation in the back half of 2025 would leave equities looking stretched.
Ready to Navigate These Markets Together?
Schedule your portfolio review to discuss how these market dynamics may impact your allocation strategy.
Schedule Your Review