Highlights
Key Takeaways
- How Much Uncertainty Can Markets Withstand?
- Market Preview: Can Treasury Yields Remain Stable? (CPI, Possible SCOTUS decision, Fed concerns)
- Economic Cheat Sheet: Inflation in Focus
- What is Cheap and What is Not at the Start of 2026
- What Could Make Markets Decline in 2026?
Stocks
S&P 500
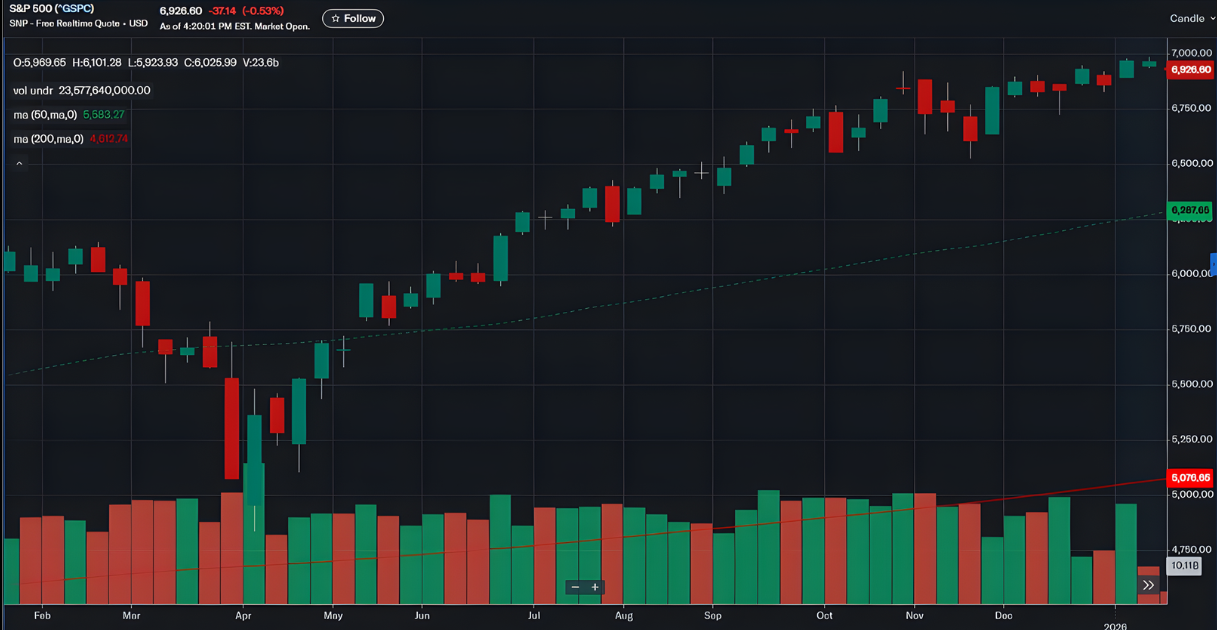
Technical View: The January rally to record highs shifted the technical outlook from cautious to bullish, albeit with only moderate conviction given momentum readings.
Dow Theory: Bullish since the week of January 5, 2026 (*Volume Is a Concern*)
Key Resistance Range: 6,978 - 7,000
Key Support Range: 6,899 - 6,845
Current Level: Hi: 6,978.36
SOURCE: Factset and Vann Equity Management Research Team
Stocks rallied last week on the first full 'back to work' week of the year, as economic data stayed Goldilocks and supported the markets.
✓ What is Outperforming: AI-related tech, cyclical sectors, small caps.
✓ What is Underperforming: Defensive sectors, energy.
How Much Uncertainty Can the Market Withstand?
Markets are often said to dislike uncertainty. That view has been tested over the past year, as stocks have advanced despite rising uncertainty around trade policy, immigration, geopolitics, and, more recently, the government's relationship with industries and corporations. Even if markets can absorb a meaningful amount of uncertainty, it is not clear that they can absorb unlimited uncertainty. Policy volatility from Washington could become a headwind for stocks in the year ahead.
Over the past year, policy uncertainty has been the highest our investment committee has seen in our careers:
- Trade policy
US trade policy shifted sharply, followed by frequent delays, revisions, and threats. Tariff policy remains unclear, with a Supreme Court IEEPA decision still looming.
- Immigration policy
Major changes have affected labor supply, with uncertain implications for inflation.
- Geopolitics
Global risks remain elevated, including the Russia-Ukraine war, heightened Israel-Iran-US tensions, and ongoing China-Taiwan tensions, alongside shifting US focus in the Western Hemisphere.
- Federal Reserve Policy
Public criticism of Chair Powell has raised questions about future Federal Reserve independence.
A new layer of uncertainty emerged as government influence on industry moved to the forefront. President Trump announced initiatives to ban investment firms from buying single-family homes and to limit credit card interest rates to 10 percent. He also threatened action against defense companies that, in his view, pay dividends that are too high or repurchase too many shares.
These announcements pressured certain sectors temporarily, but they did not weigh on the broader market. Still, they highlight a risk we should monitor in 2026: policy instability that discourages business investment or reduces earnings. Restrictions on profitable business activities can directly affect financial sector earnings, and greater government involvement in shareholder return policies can alter corporate decision-making.
To be clear, many of these proposals cannot be implemented by decree and would require legislation or regulatory action. Even so, policy signaling alone can influence corporate behavior. If government involvement in industry continues to expand, the impact could become more meaningful.
So far, markets have remained resilient, helped by offsets such as stimulus. However, persistent and widening uncertainty can eventually take a toll. We are not there yet, but the risk is rising and deserves close attention.
Economic Data
What You Need to Know in Plain English
Goldilocks economic data remained a key support for the rally so far as we kick off the year 2026. The latest releases pointed out steady, unspectacular growth that reduced slowdown concerns without forcing a more hawkish shift in rate cut expectations.
The most important report was on the jobs release, and it was broadly fine. Payrolls increased 50K vs. 70K expected, which is within a "just right" range. More importantly, the unemployment rate fell to 4.4% from 4.6%, below the 4.5% expectation. We continue to view an unemployment rate near 5% as a clearer negative economic signal, so moving away from that level was constructive. There were also downward revisions to prior job gains of 76K, largely tied to October, which was likely distorted by the government shutdown and estimation noise.
Business activity data reinforced the same message. The ISM Services PMI rose to 54.4 vs. 52.2 expected, the highest level since October 2024. The details were strong, with New Orders at 57.9, up from 52.9, and Employment at 52.0, up from 48.9, back in expansion territory. Since services represent roughly two-thirds of the US economy, this supported the view that growth remains broadly stable.
Manufacturing remained softer, with the ISM Manufacturing PMI at 47.9 versus 48.3 expected, while New Orders edged up to 47.7 from 47.4. Manufacturing has been in mild contraction for an extended period, and it has not meaningfully derailed overall growth because it is a smaller slice of the economy.
This month's data continued the "stable but not overheating" backdrop. That combination helps equities by keeping recession risk contained while allowing the market to maintain expectations for the first 2026 rate cut around April, with only one or two cuts priced for the year.
Looking ahead, the same two variables will matter most for the remainder of the month: inflation and the consumer. Softer CPI and Core CPI readings would improve the odds of additional rate cuts and add support for stocks, while retail sales and jobless claims will tell us whether consumer demand and the labor market are holding up. Goldilocks data was an underappreciated tailwind in 2025, and the market will need that balance to continue in 2026.
What is Cheap and What is Not at the Start of 2026
What is cheap and what is expensive in our current market? That is a question many investors ask at the start of the year as they consider allocation decisions. Our investment team reviewed sector valuations to identify where there is meaningful value and where valuations look stretched as 2026 begins.
How we evaluate valuations
While we rely on several metrics for simplicity, we want to focus on just two metrics:
Forward price to earnings (forward P/E): This is the institutional standard because markets price the future, not the past. Strong results with weak guidance often led to stock declines, and forward P/E captures what the market expects next.
Price to earnings to growth (P/E/G): Forward P/E alone can be misleading because some sectors look cheap due to weak growth. P/E/G helps adjust valuation for expected earnings growth and improves relative comparisons across sectors.
A sector looks most attractively valued when it ranks in the lower portion of both forward PE and PEG. Based on that screen, three sectors stand out as attractively valued: Financials (XLF), Communication Services (XLC), and Utilities (XLU).
Sector Valuations to Start 2026
| Sector | Forward P/E Ratio | PEG Ratio | Assessment |
|---|---|---|---|
| XLF Financials | 16.8X | 1.71 | Attractively Valued |
| XLC Communication Services | 18.1X | 2.39 | Attractively Valued |
| XLU Utilities | 18.5X | 2.58 | Attractively Valued |
| XLE Energy | 16.0X | 2.33 | Fair Value |
| XLB Materials | 19.7X | 2.59 | Fair Value |
| XLV Healthcare | 19.0X | 2.65 | Fair Value |
| XLK Technology | 26.4X | 2.28 | Fair Value |
| XLY Consumer Discretionary | 28.1X | 2.89 | Richly Valued |
| XLI Industrials | 29.2X | 2.75 | Richly Valued |
| XLP Consumer Staples | 18.8X | 5.19 | Richly Valued |
| XLRE Real Estate | 34.6X | 6.80 | Richly Valued |
Sectors that look attractively valued
Financials (XLF)
Financials trade is at the second-lowest forward P/E at 16.8 times, well below the S&P 500 near 22 times. More importantly, financials are the cheapest of the 11 sector SPDRs on a P/E/G basis and the only sector below 2.0. That combination is notable given the sector's strong 2025 and supportive fundamentals, including solid employment, elevated interest rates, generally low delinquency levels, and potential cost savings from AI adoption.
Communication Services (XLC)
Communication Services is also screened as relatively inexpensive despite heavy exposure to major AI leaders. XLC trades at the third-lowest forward P/E at 18.1 times and the fourth-lowest P/E/G at 2.39. META, GOOGL, and NFLX comprise roughly half of the ETF, yet overall sector valuation remains anchored by slower growth, more traditional media and cable businesses. The result is a more valuation-conscious way to maintain exposure to large platform companies as 2026 unfolds.
Utilities (XLU)
Utilities rank well in both measures, with the fourth-lowest forward P/E and the fifth-lowest P/E/G out of 11 sectors. Utilities have benefited from AI-related power demand themes, but the sector has pulled back from its heights. Valuations are not deeply discounted, but they look reasonable for investors who want income, stability, and more defensive characteristics.
Sectors that look richly valued
On the other end of the spectrum, three sectors screen as relatively expensive based on being in the upper range of forward PE, PEG, or both: Consumer Discretionary (XLY), Industrials (XLI), and Consumer Staples (XLP). Rich valuation does not prevent future outperformance, but it does raise the bar and is worth considering when sizing exposure.
Our valuation work suggests Financials, Communication Services, and Utilities offer a more attractive balance of price and growth entering 2026, while Consumer Discretionary, Industrials, and Consumer Staples look more fully valued.
What Could Make Markets Decline in 2026?
Can anything make the market go down? Some investors are asking that question because the S&P 500 has started 2026 the way it ended 2025, pushing higher while shrugging off unsettling headlines, persistent geopolitical risk, and mixed economic signals. The answer is simple. Yes, several things can drive stocks lower.
You may not hear much about those risks right now. Bloomberg reported that none of the 21 market strategists it surveyed at the end of 2025 expected stocks to decline in 2026. A broadly bullish outlook is normal on Wall Street, but complete agreement is often a warning sign. When everyone crowds into the same view, the market can become more vulnerable to surprises.
With that in mind, here are three developments that could realistically pressure stocks in 2026. Our investment team is not predicting these outcomes, but they are worth monitoring.
1. A sharp, sustained rise in Treasury yields
The last time yields rose quickly and unexpectedly, in 2022, stocks suffered a major drawdown. Several forces could push yields higher in 2026, including uncertainty around the Supreme Court IEEPA tariff decision and the selection of the next Federal Reserve chair. The larger risk is confidence in Fed independence. If markets start to believe monetary policy is becoming more politically influenced, long-term inflation expectations and term premiums can rise, which tends to lift Treasury yields and compress equity valuations.
Inflation is still above the Fed's 2 percent target, and tariffs are likely to remain in some form. In that environment, premature easing or reduced confidence in Fed independence could create conditions for a meaningful yield spike. If yields move sustainably above 4.50 percent, that can become a direct headwind for stocks.
2. A faster-than-expected economic slowdown
The labor market is currently in a no-hire, no-fire posture, which can change quickly if growth weakens. Households are still dealing with the effects of elevated inflation, and employment risk is rising as technology continues to reshape hiring. We also saw evidence of slowing momentum in the second half of 2025.
Employment has been the stabilizer that has helped consumers absorb higher prices. If the unemployment rate rises to 5% or higher in early 2026, the probability of a broader slowdown increases, and that would likely weigh on equities. Economic contractions are not rare historical events. They can happen, and markets reprice quickly when they do.
3. A reset in AI expectations
AI has been a major driver of market performance for nearly three years, but expectations are now very high. Investors are increasingly demanding proof of returns on the massive spending underway in AI infrastructure. As first-quarter earnings approach, large technology firms will face tougher questions about how hundreds of billions in capital spending will convert into measurable, durable profitability.
Even if the rest of the market initially holds up, AI-related capital spending has become a meaningful engine of incremental growth. If that spending slows at the same time that the economy weakens, the combination could be problematic for both earnings and investor sentiment.
These are plausible paths to a market decline in 2026, especially with bullish sentiment elevated. If any of these risks begin to materialize, the adjustment could be faster and more painful than many investors expect.
Ready to Navigate These Markets Together?
Schedule your portfolio review to discuss how these market dynamics may impact your allocation strategy.
Schedule Your Review