Financial Market Insight | February 2024
HIGHLIGHTS
- What Could Interrupt This Rally?
- Weekly Market Preview: Can Inflation and Growth Data Push Stocks Even Higher?
- Weekly Economic Cheat Sheet: CPI Tomorrow, Key Growth Readings Thursday.
- Special Reports for Advisors and Advanced Renders:
- Market Multiple Table Update
- Is NYCB A Canary in the Commercial Real Estate Coal Mine?
 STOCKS

“The S&P 500 traded above 5,000 last week thanks to strong Treasury auctions reducing concerns about demand for U.S. debt and on generally solid economic data.”
- What’s Outperforming: Growth factors, tech, consumer discretionary and communication services have outperformed thanks to strong earnings and continued “AI” enthusiasm.
- What’s Underperforming: Defensive sectors and value have underperformed recently mostly as Treasury yields have risen, although they are poised to rebound substantially if there is a surprise of growth.
What Could Interrupt This Rally?
Stocks extended the rally and the S&P 500 hit a new all-time high and finally topped the 5,000 level; the question that investors should be asking is not “Why did stocks keep rallying?” but rather “Why would stocks not keep rallying?”
Our investment team says that because the news and data reinforced the three drivers of this bull market:
- Fed rate cuts by May
- Solid economic growth (and no signs of a hard landing)
- Continued disinflation and strong earnings
Our broader point is this: The burden of proof lies squarely with the bears and so far, the economic data and Fed speak have not done enough to disprove any of those four bullish factors.
Now, while it is true that the burden of proof lies with the bears, and so far, they have not had any news to derail this rally, the reality is there are a number of risks emerging. Here is the point: We get the S&P 500 5k euphoria, but the inevitability of the rally is not accurate. Yes, data has pointed to a sweet spot for growth, inflation, and the Fed; but that will not last forever and there will be bad news for this market, there always is.
So, our investment team wanted to point out the risks that have quietly grown in the background during this rally:
- Rate cut disappointment: The chances of a May rate cut have declined from 100% three weeks ago to just over 70% as of last Friday. If those expectations drop below 50%, Treasury yields will rise and that will be a negative for stocks.
- Layoffs: The jobless numbers (monthly numbers and claims) are at odds with the long and growing list of companies announcing layoffs. More to that point, the key aspect of the Q4 earnings season was cost-cutting by companies (meaning layoffs mostly). For now, that is supporting earnings; however, it is our thinking that it is inevitable that these start to work their way into employment statistics in the next quarter or two. The bottom line, for now, cost cutting is positive but the number of layoffs.
- Commercial real estate (CRE): We profiled this risk last month, and what is notable is it is not just New York Community Bancorp (NYCB) that has been hurt by bad commercial real estate loans. KREF (KKR Real Estate Finance Trust) cut its dividend on bad CRE loans, and this week Treasury Secretary Yellen acknowledged risks in the CRE market, especially to non-bank lenders. The point being, this does not have to be a financial crisis to hit stocks and the likelihood of this being a non-event seems low to us.
- Valuations, enthusiasm: Our team has always maintained that valuations themselves are not something that causes a reversal in stocks; and that is the case again this time. Something bad will have to happen to disrupt this momentum higher. However, valuations and enthusiasm do make any reversal more painful and intense; and at this point, the S&P 500 is priced for perfection and could easily give back 10% if we see one of the four positive drivers of this market materially contradicted.
Bottom line: it is important to acknowledge that this rally has been driven by actual good news and bullish expectations being reinforced by actual data. At the same time, the risks that kept investors worried in October (and even throughout 2023) have not been vanquished—they simply have not shown up, yet!
From a positioning and tactical standpoint, we continue to prefer the minimum and lower volatility and value overgrowth. These metrics outperformed through January but have lagged the past two weeks into February, as tech has rallied after earnings; but the risk-reward here continues to imply we should be focused on limiting downside exposure in the event of disappointment, not reaching for upside in a market that is already trading at an unsustainable valuation (above 20X earnings) and has priced in essentially a financial version of Nirvana (low inflation, dovish Fed, solid growth, resilient earnings and no negative surprises). We suppose that can happen, but in our 30+ years in this business, we have not seen it yet (and this is not to be confused with irrational exuberance).
Economic Data (What You Need to Know in Plain English)
There were only two notable economic reports so far in February, but both supported the “No Landing” economic thesis and as such, helped the S&P 500 to touch 5,000 on Thursday. However, one of the reports also echoed a potential rebound in inflation and as such, this week’s CPI, which will be closely watched as a rebound in inflation is not at all priced into stocks (or bonds) at these levels and would cause immediate volatility.
Looking at this month’s data, the key growth report was the ISM Services PMI. In December, this number got uncomfortably close to 50 and a drop below that level would be a clear, negative economic signal. However, the January ISM Services PMI bounced back and rose to 53.4 vs. (E) 50.5 and the details were strong as New Orders, the leading indicator in the report, rose to 55 from 52.8, implying future strength.
However, the one negative in this report was a jump in the price index to 64.0 from 56.7. That is a multi-month high and, disconcertingly, it matches the jump we saw in prices from the January ISM Manufacturing PMI two weeks ago. Now, those numbers do not mean inflation is rebounding, but they cannot be discounted either, so we will need to watch inflation metrics (including this week’s CPI) because a surprise rebound in inflation would push yields higher, stocks lower and jeopardize a May rate cut and the idea of five-six rate cuts in 2024.
For now, they are just two numbers, and for a rebound in inflation to pressure stocks we will need to see higher-than-expected readings from CPI and the Core PCE Price Index.
The other notable number this month was weekly jobless claims, which declined slightly to 218k vs. (E) 227k. The weekly claims data continues to confirm other labor market readings that the jobs market remains strong. For us to become worried about the economy, we would need to see weekly claims move through 250k towards 300k and there is simply no evidence of that happening now and as such, the economy remains remarkably strong.
Looking at the growth data, all the important reports come on Thursday. The key growth reports this week is retail sales for the simple reason that the U.S. economy is consumer-driven and as long as retail spending is solid, it is very hard to envision a real economic slowdown.
We also get the first look at February economic activity via the Empire and Philly Fed manufacturing indices (both out Thursday morning). These regional indices have been especially volatile lately and not correlated to the more important ISM Manufacturing PMIs, but they still matter and if both show significant weakness that will be an incremental negative, while coordinated strength will be a positive for markets.
Bottom line: This market has rallied on the ideas of 1) Fed rate cuts (meaning May or earlier), 2) Stable growth and 3) Continued falling inflation. The data this week has the opportunity to continue to reinforce those expectations (and support S&P 500 5,000) or refute them (and pressure stocks), so this is an important week for investors.
COMMODITIES, CURRENCIES & BONDS

“Commodities rallied moderately last week thanks mostly to gains in oil, as a lack of a ceasefire in Gaza increased geopolitical tensions and sent oil sharply higher on the week.
Commodities remain mixed as a stronger dollar, fading hopes for economic growth overseas and easing inflation worries continue to weigh on the metals, while escalating geopolitical tensions resulted in energy bucking, the otherwise heavy trend, with oil posting a solid gain.
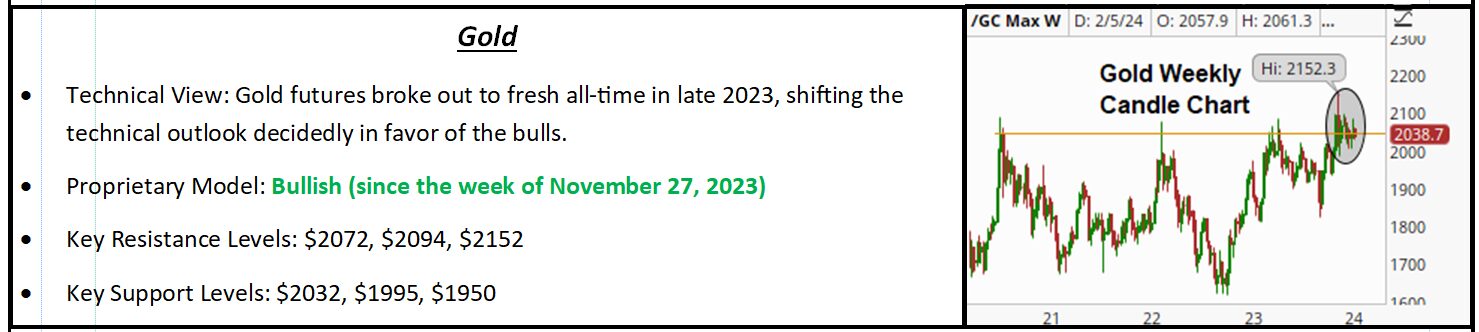
Trading in gold has remained quiet as futures remained pretty well pinned to the $2,050 level, oscillating on either side before revisiting the key technical level. The modest rise in the dollar and rebound in Treasury yields were negative fundamental influences on gold; however, and there was some meaningful technical weakness in the price action into the weekend leaving risks of a near-term pullback in gold elevated. Look for initial support at $2,000/oz. as the long-term outlook remains bullish given the new record highs in late 2023.
For now, the outlook for the oil market remains cautiously bullish supported by the fact that the term structure of the futures market reverted to backwardation, indicating a bullish imbalance in supply and demand in the physical market.
Bottom line: the best-case scenario for the Israel-Hamas conflict, a ceasefire, is the worst case for the oil market right now.
SPECIAL REPORTS FOR ADVISORS AND ADVANCED RENDERS
Market Multiple Table Update
The February update of the Market Multiple Table clearly and efficiently delivers this message:
“The current drivers of stocks and bonds are positive, but at these levels the market has priced in essentially zero chance of disappointment. If we do get negative news from any of these drivers, a 10% correction is not just warranted, it’s likely.”
Looking at the changes in this month’s Market Multiple Table, there were several positive changes. Starting with Fed policy expectations, the biggest point is that the Fed formally acknowledged that rate cuts are coming and as such, that is a positive, as it increases the market multiple (which rose to 18.5X-19.5X). Now, our team did see some slight deterioration there, as Powell did push back against a March rate cut. However, as we have pointed out, March vs. May does not really matter and markets do still expect five or six rate cuts in 2024, so the outlook for the Fed remains dovish.
Turning to growth and inflation, the news for the month was also positive. Economic data is showing some signs that momentum may be plateauing, but at the same time there are no hints of a soft landing. On inflation, metrics have largely continued to decline and most importantly, the past six month’s core inflation readings annualized have been below 2.0% y/y, meaning that the Fed has reason to think inflation has returned to target.
Finally, on earnings, the important takeaway from the Q4 earnings season (which just ended) was that the $240-$245 2024 S&P 500 earnings range remains intact; but we have seen mild deterioration as the consensus is now around $243, down from the previous $245.
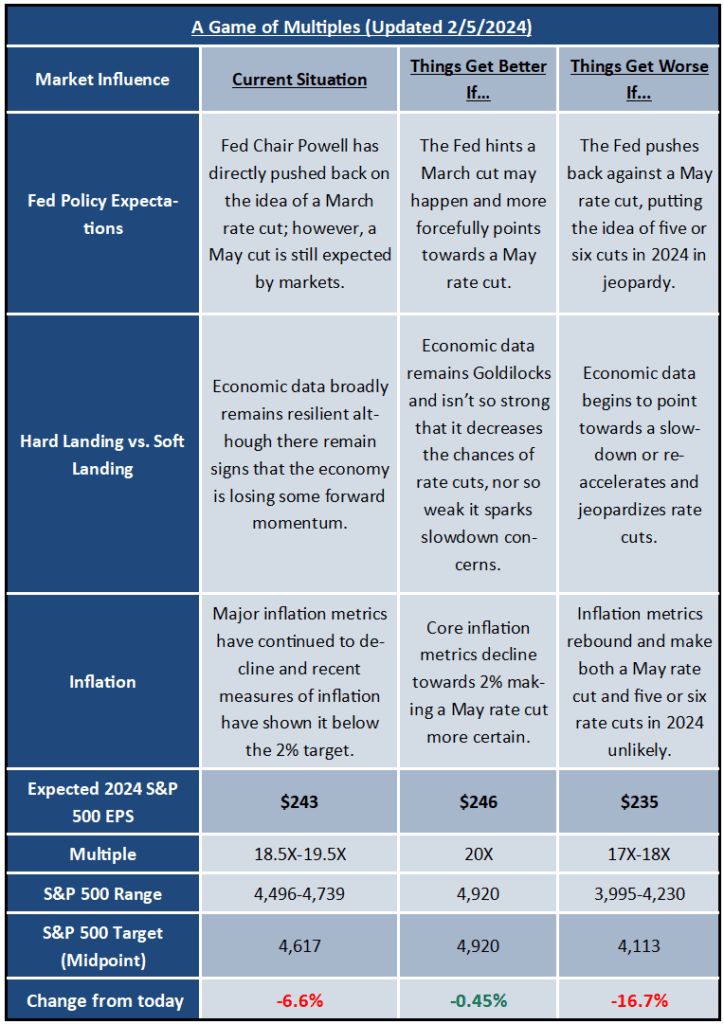
The market has more than priced in the “Gets Better If” scenario from last month, as the S&P 500 traded above that estimate. The problem, of course, is that while the current drivers of the market are positive, all of them still have the potential to reverse. None of them is a “done deal” and as such, pricing in the “Better If” scenario is aggressive and it is why these levels are not supported by fundamentals (but they are supported by momentum).
Bottom line: The net takeaway is that the outlook for stocks remains positive, but this market also remains “over its skis” from a valuation standpoint. That does not mean the rally cannot continue on momentum, but it is a clear signal that a sudden, sharp pullback in real disappointment should not be a surprise.
Current Situation: The Fed has pushed back on March rate cuts, but May is still likely and markets expect five or six cuts in 2024, economic growth remains solidly positive but not “Too Hot,” inflation continues to trend lower towards the Fed’s 2% target making a rate cut likely sooner than later (May). The current situation reflects the positive drivers that have powered stocks higher since the start of the year, as the Fed has acknowledged rate cuts are coming, economic growth has remained resilient but has not been “Too Hot” while inflation metrics, including the most recent data, are pointing towards a continued decline in inflation. This generally positive set-up has underwritten the gains in stocks YTD.
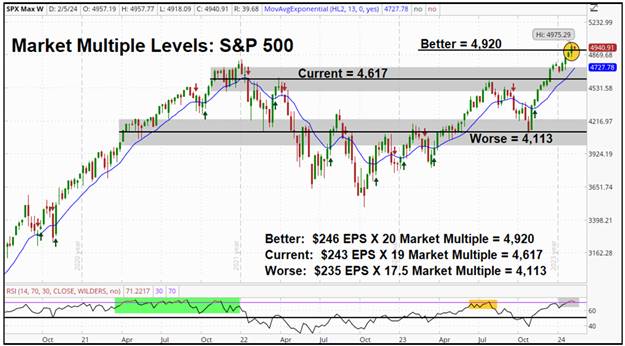
Things Get Better If: The Fed confirms a May rate cut, economic data stays Goldilocks and inflation continues to decline towards the Fed’s 2% target. This environment would solidify the positive macro environment for stocks and bonds and extend the reasonable valuation for this market above 4,900. This would essentially reflect a “perfect” environment for stocks of 1) Imminent rate cuts (so a higher market multiple), 2) Strong but not “Too Hot” growth and 3) Falling inflation. While not totally justified by valuations, given momentum, in this environment a run in the S&P 500 towards 5,000 would be reasonable.
Things Get Worse If: The Fed materially pushes back on the idea of rate cuts in May and the expectation for five or six cuts this year, economic growth suddenly rolls over or materially accelerates, and inflation metrics (CPI/Core PCE Price Index) rebound. This scenario would essentially undermine the assumptions behind much of the Q4 and January rally and given how stretched markets are, the net result would be substantial declines in stocks and a giveback of much of the October-to-January rally would not be out of the question. While it seems like this outcome is not possible given the current positive outlook, none of this is set in stone and this is a legitimate scenario we need to be mindful of, because it is possible if data breaks the wrong way.
Is NYCB A Canary in the Commercial Real Estate Coal Mine?
New York Community Bank (NYCB) stock has continued to decline following its disastrous earnings report and because the main reason for NYCB’s unexpected quarterly loss was two poorly performing commercial real estate loans (one on a co-op building and one office building) that has resurrected worries that the commercial real estate market may be a brewing crisis on the horizon.
Those concerns are not unfounded and commercial real estate is a legitimate risk to this market and the economy, but it has to be viewed in the appropriate context. So, we wanted to cover:
1) Why commercial real estate worries are legitimate,
2) If it can be compared to what occurred in ’07/’08 and,
3) What any type of commercial real estate stress means for markets.
Why Are People Worried About Commercial Real Estate? The commercial real estate (CRE) market is facing stress and prices are declining thanks to the dramatic Fed rate hikes of the past two years and the lingering impact of the pandemic.
Commercial real estate loans are very different from residential mortgages, but two particular differences make CRE especially susceptible to quickly rising rates. First, most CRE loans are “interest only” meaning there is no principal reduction. Second, they are mostly variable rates, meaning the interest rate resets every several years. That means CRE is especially sensitive to a sharp and intense increase in rates (like we have seen over the past two years) because the amount of principal outstanding never declines and because a big increase in interest expense can make CRE projects unprofitable, which can result in fire sales that further depress property values.
This is what has started to happen in recent months as the CRE market is performing poorly. Based on Fed data, the delinquency rates on CRE loans have risen to 1.07%, which is only slightly below the 1.13% Q4 2020 high (at the peak of the pandemic shutdowns). That 2020 reading was the highest level since 2015, so if we see the default rate rise above 1.13%, that will be a nine-year high and a clear sign of deterioration.
Looking forward, it is reasonable to expect delinquency rates to rise as the IMF estimates there is $1.2 trillion in CRE debt that is maturing (and will have to be renegotiated at potentially higher yields) in the next two years. The whole CRE market is valued at slightly over $5 trillion, so we are talking about 20% of the market, not an insignificant amount.
Finally, the deterioration in the CRE market is impacting prices. According to the IMF, an aggregate measure of CRE prices has dropped more sharply than during any other Fed tightening cycle over the past 50 years. Aggregate prices of CRE have declined more than 12% over the past two years, much more than during any other tightening cycle. The office portion of the CRE market is especially weak thanks to the slow return of the American worker to the office and the permanent changes to demand for office space as more workers go hybrid. Default rates for office related CRE projects (which make up more than 13% of the CRE market according to Vanguard) have risen above 5% and are pricing in stress.
Bottom line: a combination of higher rates and workplace changes have negatively impacted the CRE market and default rates are rising, and prices are declining. However, for this to be material, negative influence on broad markets, we must see evidence of contagion, as that is the key to determining when one sector’s stress becomes a major problem for markets.
Can What is Happening in CRE Be Compared to the Origins of the Housing Crisis? So far, thankfully the answer is “No,” but the list of similarities is growing. One of the key factors that made the subprime implosion so damaging to the economy and markets was the failure of regulators and investors to understand the reach and depth of leverage in the deals. In 2007, it would have been laughable to think a collapse in subprime housing would have bankrupted AIG (an insurance company) and General Motors (via the GM Financing unit). Yet, that is what happened.
So, it was disconcerting to learn about rising stress in the mezzanine funding portion of the real estate market, which is linked to CRE. Mezzanine financing is utilized by investors who are looking to buy a property and either 1) Can not obtain enough equity for a conventional purchase or 2) As a way for investors to increase total leverage and boost returns (and risk). Essentially, think of mezzanine financing as covering the gap between equity and a conventional mortgage, but with a higher interest rate and higher risk.
In many ways, it is reasonable to expect any real, significant stress in the CRE market to appear in these mezzanine deals, and according to the WSJ, that is what is starting to happen. The WSJ compiled a list of what it believes to be mezzanine-related foreclosures filed through October 2023 and the number was a record high. The WSJ estimates there were 62 mezzanine-related foreclosures (which are very hard to track because they are not conventional mortgages) in 2023, nearly double the amount in 2022; and given the difficulty in identifying these foreclosures, it is reasonable to assume there are many more in the pipeline.
This is concerning for two main reasons. First, it implies the stress in the CRE market is getting progressively worse. Second, it reveals the liability from CRE debt may run deeper and stretch wider than it is currently believed. We say that because while regulated banks are much better capitalized compared to before the GFC and the Fed and other institutions can quantify those banks’ CRE risk, it is much harder to do so with the mezzanine deals because many of the loans are made by private investment groups such as PE firms and asset management companies. If these mezzanine deals go south, it has the potential to create contagion across previously thought to be unrelated assets. Thankfully, at this point, it would be an exaggeration to link what could happen with the CRE market to the housing crisis.
First, the size of the markets is vastly different. The residential real estate market is valued at over $50 trillion. The CRE market is valued at around $5 trillion. The point being, that the potential problem is much smaller than what we were facing in the residential real estate market in 2007. Additionally, the key from a systemic standpoint remains the large banks and they should be mostly insulated from any substantial CRE risks due to 1) More stringent capital requirements and 2) The fact that they are too big to fail, and in the end, we know how this goes if it gets bad enough (with the Fed extending funding).
But just because this is not lining up to be a repeat of ’07/’08 does not mean it could not impact markets directly and intensely. Headwinds in commercial real estate (CRE) have the potential to impact markets from both a macro and micro-economic standpoint as stress in the CRE market would pressure most assets broadly and specific sectors directly.
Macro Impact: All about contagion. From a macro/broad-market standpoint, the concern here (as it is with all industries facing stress) is contagion, so the focus first is to monitor for any signs of contagion and that brings us to the banks, specifically regional and community banks.
Losers: Banks. Community and regional banks provide the majority of CRE funding and if what we saw with NYCB is an initial sign of CRE-related bank stress, we should start to see it materialize more fully in the community and regional bank ETFs and stocks. QABA is the First Trust NASDAQ ABA Community Bank Index Fund. It has $90 million in AUM and is mostly traded by appointment, but it contains some of the more liquid publicly traded community banks such as Commerce Bancshares (CBSH), Wintrust Financial (WTFC), Bank OZK (OZK), and United Bankshares (UBSI). The community bank stocks in the index are liquid enough that if we see CRE increasing bank contagion risks, it should show up in these names. Bottom line, QABA is a decent indicator for CRE-related banks stress and if it begins to drop sharply, that is a negative signal (it is already down 10% YTD but if that keeps going, it is a clear negative). Regional banks (of which NYCB is considered one, although it is on the larger end of the spectrum) are also a useful indicator for increased contagion signs and like QABA, KRE is down 10% YTD with the majority of the declines coming after the NYCB earnings announcement.
Winners: Treasuries. If we see contagion risks begin to spread regarding CRE risks, we will see a standard risk-off move across assets that will include a flight to Treasuries. Additionally, markets have revealed that they expect any CRE-related stress to result in more aggressive Fed rate cuts, which is why the 10-year yield fell 30 basis points following the NYCB earnings release. If the market believes contagion is spreading, then TLT, the iShares 20+ Year Treasury Bond ETF, should be one of the biggest beneficiaries as investors move to 1) Capture risk-free yields as rates fall and 2) Position for a more likely economic slowdown.
Bottom line: Contagion is the major, macro risk to markets and if we see CRE-related contagion concerns start to grow and spread, that will hit the bank stocks and specifically the community banks (QABA) and the regional banks (KRE) and that is what we will watch going forward to monitor contagion concern. But that contagion will almost certainly result in sharply falling yields and a risk-off move across assets that will benefit Treasuries (but not corporate bonds) and TLT is a likely place to hide and outperform.
Micro Impact: REITs. The majority of publicly traded REITs are focused and exposed to commercial real estate via office and retail properties (malls) and multi-family housing. As such, they are acutely susceptible to a declining CRE market.
Most Vulnerable: Office & multi-family housing focused REITs. We have seen that play out as XLRE, the Real Estate Sector SPDR, has declined 4% YTD. But commercial real estate is a diversified space and for some contrarians out there, the declines in REITs on CRE worries may present some interesting longer-term opportunities, especially if one thinks the Fed will dramatically cut rates.
Within the CRE space, office related CRE projects are considered the most vulnerable to declines. That was the belief before the NYCB earnings debacle and that is even more so, now.
Similarly, there are also concerns about the multi-family CRE segment, which is defined as buildings and projects with more than four residences and this one is of particular importance because while the office segment is just about 13% of the 5% Trillion CRE market, the multi-family segment is about 40% of the CRE market or about $2 trillion dollars. From a macro sense, if we see weakness in the multi-family segment starting to spread (remember one of NYCB’s delinquent loans was on a co-op building), that is a clear broader negative. But from a tactical standpoint, it also makes us want to avoid residential REITs until there is more clarity.
Disclaimer: The Financial Market Insight is protected by federal and international copyright laws. Vann Equity Management is the publisher of the newsletter and owner of all rights therein and retains property rights to the newsletter. The Financial Market Insight may not be forwarded, copied, downloaded, stored in a retrieval system, or otherwise reproduced or used in any form or by any means without express written permission from Vann Equity Management. The information contained in Financial Market Insight is not necessarily complete and its accuracy is not guaranteed. Neither the information contained in Financial Market Insight, nor any opinion expressed in it, constitutes a solicitation for the purchase of any future or security referred to in the Newsletter. The Newsletter is strictly an informational publication and does not provide individual, customized investment or trading advice. READERS SHOULD VERIFY ALL CLAIMS AND COMPLETE THEIR OWN RESEARCH AND CONSULT A REGISTERED FINANCIAL PROFESSIONAL BEFORE INVESTING IN ANY INVESTMENTS MENTIONED IN THE PUBLICATION. INVESTING IN SECURITIES, OPTIONS AND FUTURES IS SPECULATIVE AND CARRIES A HIGH DEGREE OF RISK, AND SUBSCRIBERS MAY LOSE MONEY TRADING AND INVESTING IN SUCH INVESTMENTS.